Data Handling and Analysis — Study Notes
Ask seven athletes how many push-ups they did in a minute, and one showoff cranks out thirty while the rest sit around ten. Report "the average" as a single number and you can make that data set sound almost anything you like — which is exactly why O-Level asks you to know three different kinds of "typical", not just one.
Three Ways to Describe a "Typical" Value
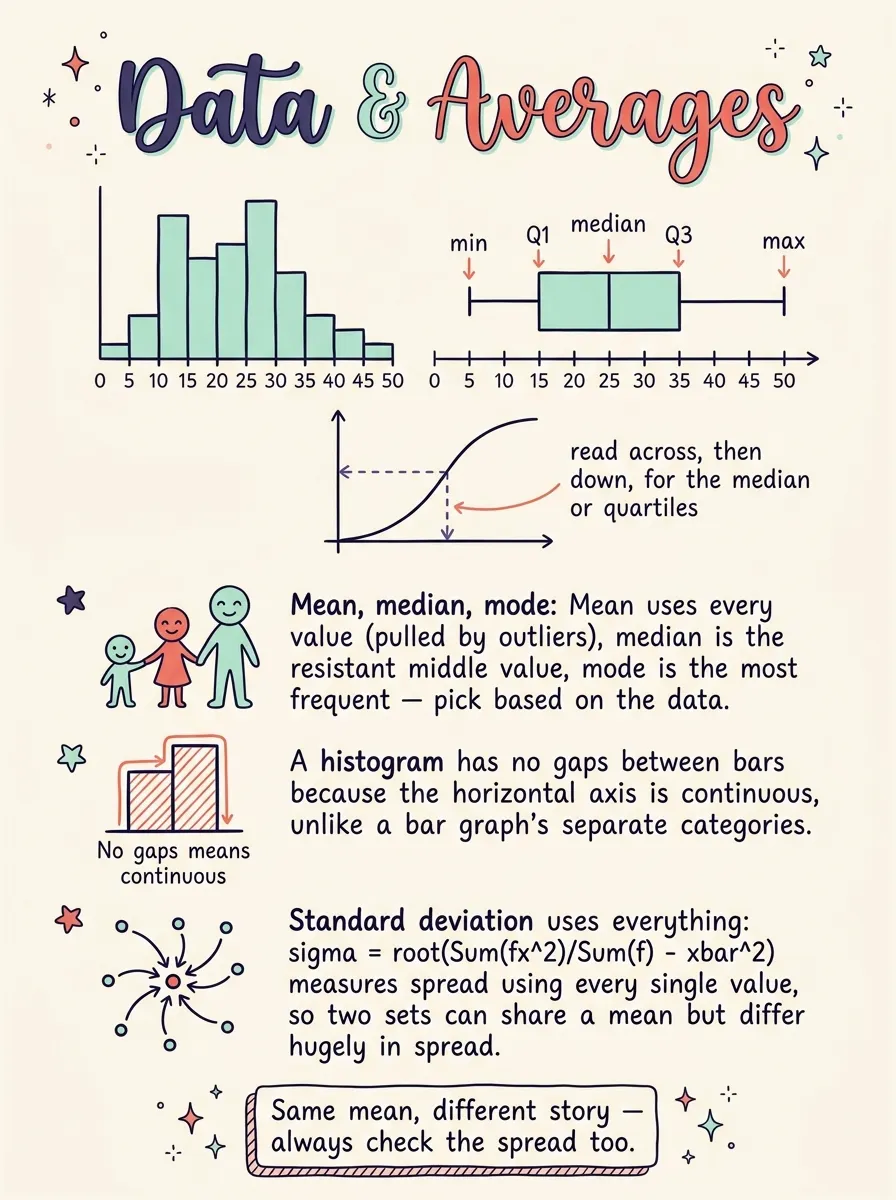
The mean sums every value in the set and shares that total evenly across however many values there are. It uses every single entry, which sounds fair, but it also means one freakishly large or small entry can pull the answer well away from where most of the data actually sits. The mode is simply whichever number shows up more than any other in the list — handy even for data that isn't numeric at all, though a set can easily have no repeated value, or several tied for most common. The median asks you to line every value up from smallest to largest and pick out whichever one lands dead centre: with an odd count of values there's a single value sitting there; with an even count you land between two values, so you average that pair. Because the median and mode ignore how far away the extreme values actually are, they barely budge when one entry in the set is way out of line — the mean, built to account for that entry too, moves a lot more.
Worked Example — Mean, Mode and Median of Push-up Counts
- Seven athletes recorded these push-up counts: 8, 10, 14, 30, 10, 12, 10. Sorted smallest to largest: 8, 10, 10, 10, 12, 14, 30.
- Mean: total the seven counts, 8 + 10 + 10 + 10 + 12 + 14 + 30 = 94, then share across 7 athletes: 94 ÷ 7 ≈ 13.4.
- Mode: scanning the sorted list, the count 10 turns up three separate times, beating every other value, so the mode is 10.
- Median: seven is an odd count, so there's one middle position, the 4th value along the sorted list: 8, 10, 10, 10, 12, 14, 30 — median = 10.
Notice the mean (≈13.4) sits well above both the mode and the median (10 each) — dragged upward by that one athlete's 30, exactly the kind of skew the mode and median shrug off.
Grouped data, quartiles, spread and the honest-versus-misleading side of a chart all get their own worked walkthroughs — plus a listen-along audio explainer and a practice worksheet — in the full lesson below.
Keep going — unlock the whole topic
Notes, audio and the worksheet for this topic, plus every other topic in the subject.
Claim a free seat →