Functions and Graphs — Study Notes
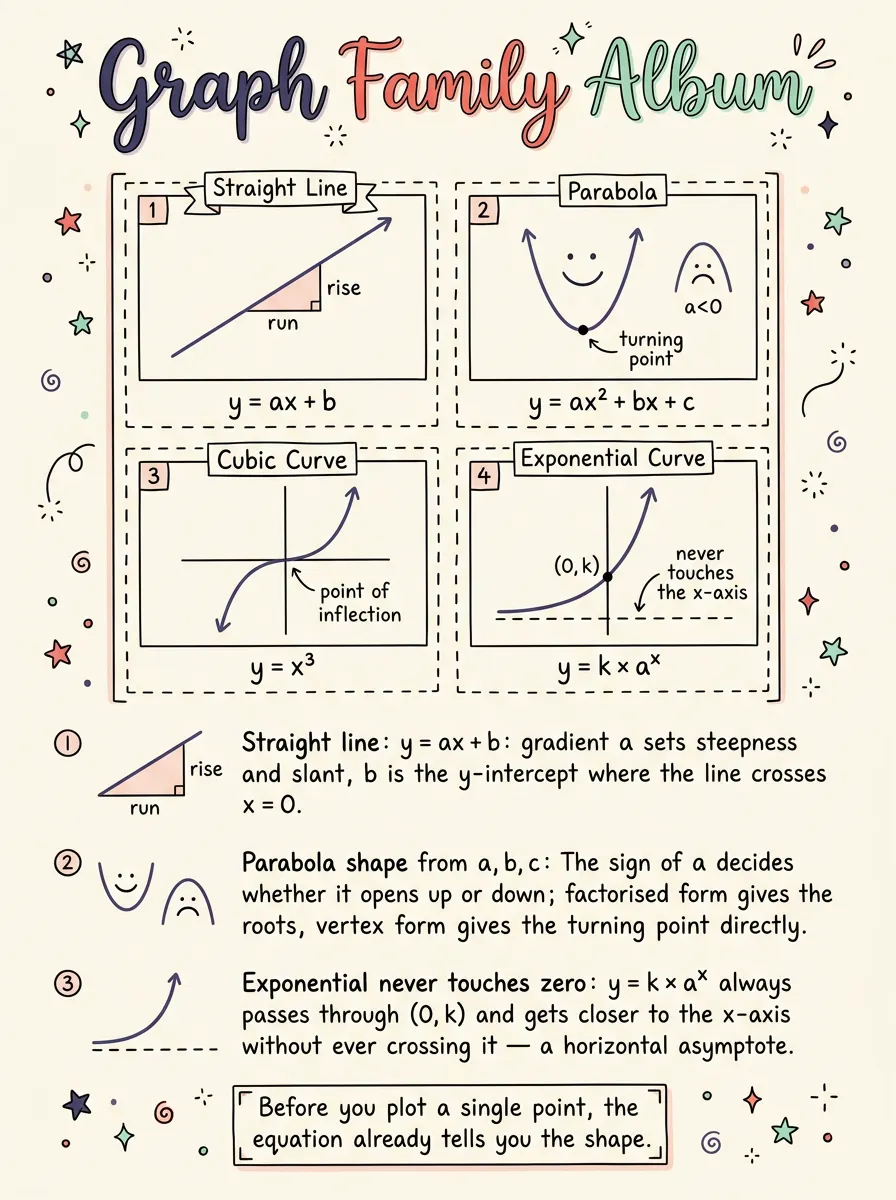
Give a friend two numbers about a straight line and nothing else, and they can redraw it exactly — no table of coordinates required. That's the shortcut worth mastering before anything else in this topic: once you know how a line's equation encodes its steepness and its starting height, every straight-line question turns into a quick two-step read-off.
Cracking the Straight-Line Equation
Any straight line can be written as y = mx + c. The number m tells you how steeply the line climbs or drops for each step you move sideways, and its sign tells you which way: climbing left-to-right is positive, dropping left-to-right is negative. The number c tells you the line's starting height — its y-value when x is zero. Exam papers rarely serve the equation this neatly, though: something like 3y = 6x + 9 describes the identical line, but m and c stay hidden until every term is divided through by 3, leaving y on its own: y = 2x + 3, so m = 2 and c = 3.
Handed two coordinates instead of an equation, you can work out steepness directly: take the difference between the second coordinates and divide it by the difference between the first coordinates, keeping matching order on top and bottom. Because a straight line never bends, that ratio comes out identical wherever along the line you happen to measure it — which is exactly why it's a fair way to describe the whole line, not just one stretch of it.
Worked Example — Finding a Line's Steepness
- A line passes through (0, −1) and (6, 11). Fix a consistent labelling: (x₁, y₁) = (0, −1) and (x₂, y₂) = (6, 11).
- Difference between the second coordinates: 11 − (−1) = 12. Difference between the first coordinates: 6 − 0 = 6.
- Divide the two: 12 ÷ 6 = 2, so m = 2. A positive result confirms the line climbs as x increases — consistent with y rising from −1 up to 11.
Muddle the order — subtracting one sequence on top and a different sequence underneath — and the sign flips, turning a rising line into a falling one on paper without you noticing.
Quadratics, power curves and exponential curves each build their own shortcuts on top of this one, and there's a further skill for estimating how steep a curved (rather than straight) graph is at a single point — all covered with a full set of worked examples, the audio walkthrough and the practice worksheet in the full lesson below.
Keep going — unlock the whole topic
Notes, audio and the worksheet for this topic, plus every other topic in the subject.
Claim a free seat →